Creating a listing, uploading a video, or publishing a Short is only the beginning. After your content starts receiving activity, Npati Analytics gives you a simple place to check how it is performing.
From the Analytics page, you can quickly review important account and content statistics, including subscribers, total views, likes, comments, listing activity, video performance, and Shorts performance.
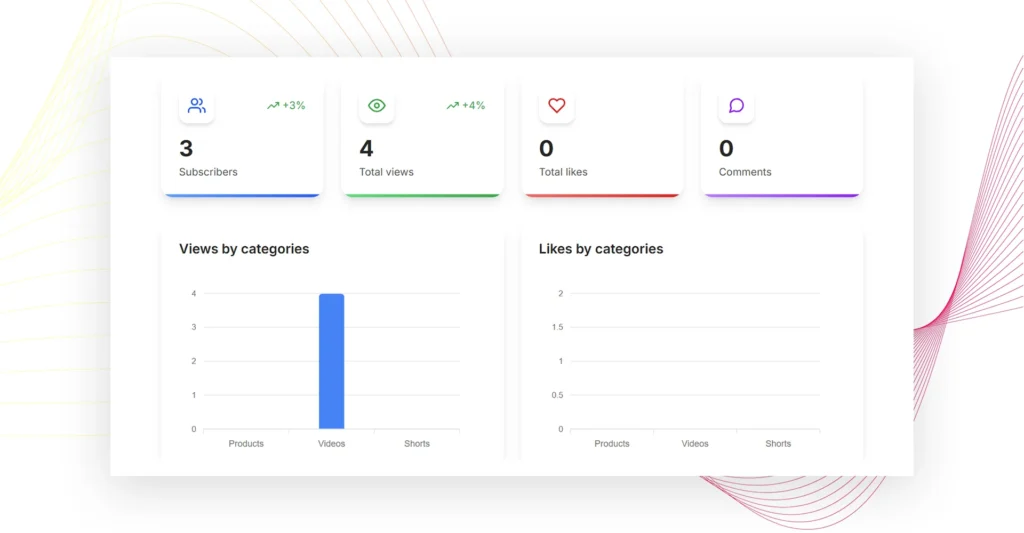
The page is designed to give sellers and creators a fast overview rather than overwhelm them with complicated reports.
If you recently created your Npati account, your Analytics page may initially contain little or no data. However, once you publish listings, videos, or Shorts and people begin interacting with them, your statistics will start to become more useful.
In this guide, you will learn how to use Npati Analytics, refresh your statistics, understand the main metrics, review Products, Videos, and Shorts, and use performance data to improve future content.
What Is Npati Analytics?
Npati Analytics is a dashboard that shows statistics for your listings, videos, Shorts, and account activity.
It gives sellers and creators a quick way to understand how their content is performing without opening every listing or video individually.
Depending on your activity, the Analytics dashboard can show information such as:
- Subscribers
- Total views
- Total likes
- Comments
- Views by categories
- Likes by categories
- Product performance
- Video performance
- Shorts performance
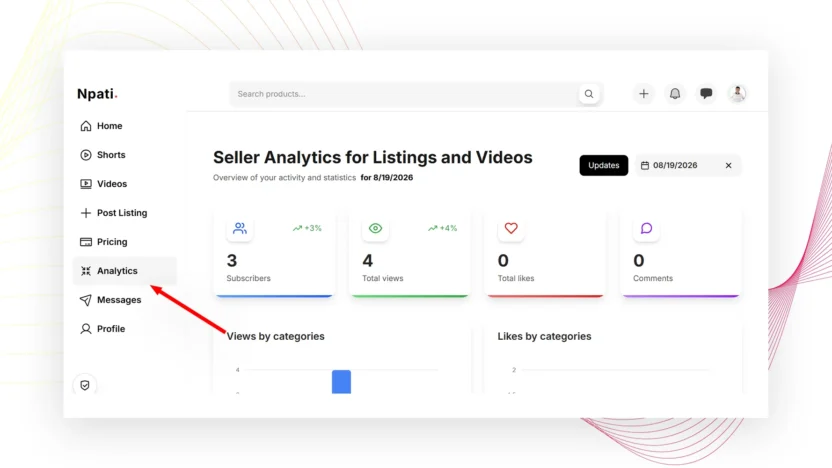
For example, the top of the page may display information similar to:
Seller Analytics for Listings and Videos
Overview of your activity and statistics
Below that area, you can see your current statistics and the date associated with the analytics information.
Because the dashboard brings several types of activity together, it can help you quickly answer questions such as:
- Are people viewing my listings?
- Which content is getting attention?
- Are my videos receiving views?
- Are users liking my content?
- Am I gaining subscribers?
- Which categories are receiving more activity?
- Are my Shorts being viewed?
Instead of guessing, you can use your actual Npati activity to understand what is happening.
Where to Find Analytics on Npati
First, sign in to your Npati account.
After signing in, look at the menu on the left side of the page.
Select:
Analytics
The Analytics page will open and display the statistics currently available for your account.
If you are completely new to Npati and do not have an account yet, start with How to Create a Npati Account.
After registration, you can also follow How to Set Up Your Npati Profile before publishing your first content.
Why Is My Npati Analytics Page Empty?
A new account may not have analytics data yet.
That is normal.
Analytics become more useful after you start publishing content and other users begin viewing or interacting with it.
For example, you can create:
- Marketplace listings
- Videos
- Shorts
If you have not created any products yet, the Products section may display:
You don’t have any products yet
You may also see a button such as:
Create first product
Similarly, if you have not uploaded Shorts, the Shorts section may show:
You don’t have any shorts yet
with an option to:
Upload Shorts
Therefore, an empty Analytics dashboard does not necessarily mean something is wrong. In many cases, it simply means your account does not have enough published content or activity yet.
Create Content Before Checking Performance
To make Analytics useful, start by publishing something on Npati.
If you want to sell an item, follow the complete How to Create a Listing on Npati guide.
A marketplace listing can include information such as:
- Title
- Description
- Category
- Price
- Condition
- Photos
- Product video
- Location
After your listing is published, users can begin discovering and viewing it.
Alternatively, you can upload videos or create short form content.
For Shorts, see How to Upload a Short Video on Npati.
As your content receives activity, return to Analytics to check the results.
How to Refresh Npati Analytics
When you return to the Analytics page, use the Updates button to refresh the statistics displayed on the dashboard.
This is especially useful after you have recently created a listing, uploaded a video, published a Short, or received new activity.
The basic process is simple:
- Open Npati.
- Sign in to your account.
- Select Analytics from the left menu.
- Click Updates.
- Review the refreshed statistics.
After the update, you can compare your listings, videos, Shorts, and overall account activity.
The page also displays a date so you can see the period associated with the information currently shown.
For example, a dashboard viewed on August 19, 2026 may display:
08/19/2026
Naturally, the date shown on your account will depend on when you are viewing your Analytics page.
Understanding the Npati Analytics Overview
The top area of Analytics provides a fast summary of your account performance.
Rather than checking individual pieces of content immediately, start here.
You may see metrics such as:
Subscribers
Subscribers shows the number of users currently subscribed to or following your content where that metric applies.
For a seller or creator, subscriber growth can be a useful signal that people want to continue seeing what you publish.
For example:
3 Subscribers
If the dashboard also displays a percentage change, you may see something such as:
+3%
That gives you additional context about the change shown for that metric.
Total Views
Total views gives you a quick overview of how much viewing activity your content has received.
For example:
4 Total views
Views can help you understand whether your content is being opened or watched.
However, views should not be considered alone. A listing may receive views without likes, while another piece of content may have fewer views but stronger engagement.
Therefore, compare views with your other metrics.
Total Likes
Total likes shows how many likes are represented in your current analytics overview.
For example:
0 Total likes
A zero does not automatically mean the content is unsuccessful.
If the content is new, it may simply need more time and more views.
In addition, different types of content can receive different levels of interaction. A marketplace listing, for instance, may generate interest or messages even when users do not press Like.
Comments
The Comments metric provides another indication of engagement.
Comments can be especially useful for video and social content because they show that viewers did more than simply watch.
A person might ask a question, react to the content, or continue a discussion.
Consequently, comments can help you identify content that encourages stronger interaction.
What Do Percentage Changes Mean?
Some metrics may display a percentage beside the total.
For example:
+3%
or:
+4%
A positive percentage helps show that the displayed metric has increased relative to the comparison used by the dashboard.
The total number remains important, though.
If you see:
+4%
and:
4 Total views
the percentage provides additional context, while the number tells you the current total represented on the page.
For a new account, these percentages may change quickly because the starting numbers are still small.
As you publish more content, trends can become easier to evaluate.
Views by Categories
Another useful section is:
Views by categories
This area helps you understand how viewing activity is distributed across the categories connected to your content.
For a seller with products in several marketplace categories, this can be particularly helpful.
Imagine that you publish listings in:
- Electronics
- Home & Garden
- Fashion
- Vehicles
If one category consistently attracts more views, that information can help you understand what your audience is currently interested in.
However, do not assume that a lower performing category should always be abandoned.
The number of listings, product quality, pricing, photos, descriptions, location, and demand can all affect performance.
Instead, use category statistics as one signal when evaluating your content.
Likes by Categories
The Likes by categories section gives you another way to compare activity.
Views show that people are discovering content. Likes, meanwhile, can indicate a stronger level of interest.
For example, one category might receive many views but relatively few likes.
Another category could have fewer views but a higher level of engagement.
That difference may help you decide what types of listings or content deserve closer attention.
Over time, comparing category views and category likes can make it easier to understand which parts of your account attract the strongest response.
Understanding the Products Section
The Products section focuses on your marketplace listings.
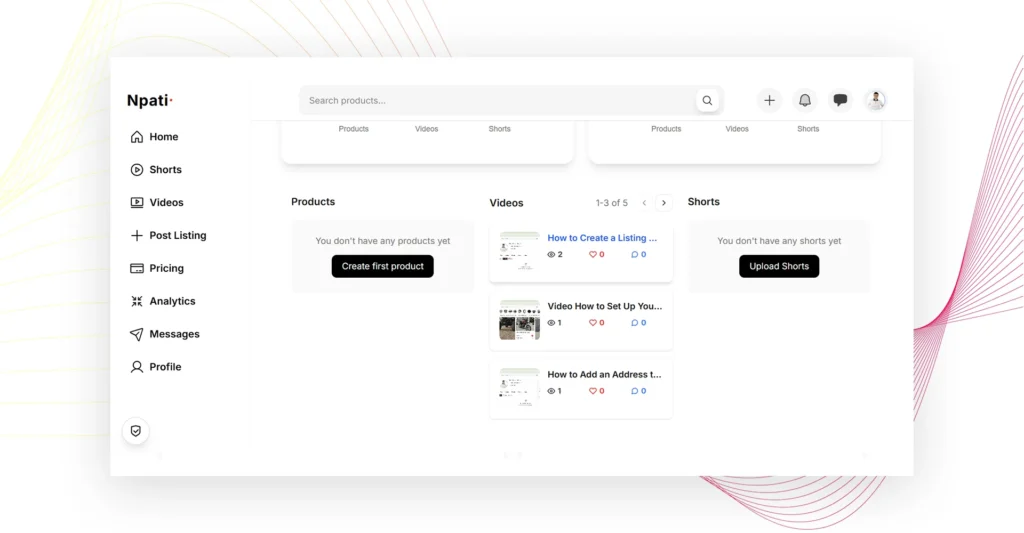
If you have not created a product yet, you may see:
You don’t have any products yet
and:
Create first product
Once you have active content, this section can give you a quicker way to review listing performance from Analytics.
For sellers, this is one of the most useful parts of the dashboard.
Suppose you publish several listings. Instead of opening each product page separately just to understand activity, Analytics lets you review performance from one central area.
Then, if one listing performs better than another, you can investigate why.
Ask yourself:
- Does the better listing have clearer photos?
- Is the title easier to understand?
- Is the price more competitive?
- Is the description more detailed?
- Is the product in the correct category?
- Does it include video?
- Is the item easier to buy locally?
These questions turn analytics into practical information.
Improve Listings Based on Analytics
Analytics are most useful when you act on what you learn.
For example, imagine that one product has views while another similar listing receives very little attention.
First, compare the titles.
A clear title tells buyers exactly what the item is.
Next, review the descriptions.
Useful details can make it easier for buyers to decide whether the product matches what they need.
Photos matter as well.
If one listing has multiple clear product photos and another has only one weak image, visual presentation could affect user interest.
For more help, read How to Write a Better Npati Listing.
You can also use How to Add Photos to a Npati Listing to improve the visual presentation of your products.
Understanding the Videos Section
Npati Analytics also includes a Videos section.
When you have multiple videos, the section can display a range of items currently being shown.
For example:
1-3 of 5
This means you are viewing part of a larger collection of video content.
Performance numbers connected to those videos can help you quickly compare activity.
Instead of treating every upload the same, look for patterns.
Perhaps one video attracts more views because the topic is clearer.
Another video might receive more likes because it demonstrates something useful.
A third could perform differently because of its presentation.
By comparing the results, you can gradually learn what your audience responds to.
How to Use Analytics for Product Videos
Video can be valuable for marketplace sellers because it can show details that may be difficult to communicate with a single image.
For example, a seller might use product video to show:
- An electronic device working
- The condition of a used item
- Different angles of furniture
- A vehicle interior
- Product size
- Moving parts
- Included accessories
If you notice that listings with product video receive more attention, consider adding video to other suitable listings as well.
You can learn how in How to Add Product Video to a Npati Listing.
The goal is not to add video simply because the feature exists. Instead, use it when video gives buyers useful information.
Understanding the Shorts Section
Shorts have their own section in Analytics.
If you have not uploaded any short videos yet, you may see:
You don’t have any shorts yet
and:
Upload Shorts
Once you begin publishing Shorts, you can return to Analytics to review their performance.
Short form video can be useful for quickly presenting:
- A product
- A feature
- A before and after view
- A quick demonstration
- A new listing
- A seller update
- A short informational video
Because Shorts are designed to be consumed quickly, their performance may differ from regular videos or marketplace listings.
Therefore, compare Shorts with other Shorts rather than assuming every type of content should produce identical results.
If you have not published one yet, follow How to Upload a Short Video on Npati.
Video: How to Use Npati Analytics
Watch the video below for a visual walkthrough of the Npati Analytics dashboard.
[INSERT NPATI VIDEO EMBED HERE]
The video can show:
- How to sign in to Npati.
- Where to find Analytics in the left menu.
- What a new Analytics page looks like.
- What happens when you have no products or Shorts.
- How to click Updates.
- Where to see Subscribers.
- Where to check Total views.
- How to review Total likes.
- Where Comments appear.
- How Views by categories works.
- How Likes by categories works.
- Where to review Products.
- How to check Videos.
- Where Shorts appear.
- How to compare content performance.
After watching the video, return to your own Analytics page and compare the statistics with your published content.
A Simple Analytics Workflow for New Sellers
You do not need a complicated reporting strategy when you first start using Npati.
A simple workflow is enough.
Step 1: Create Your First Listing
Publish a complete listing with an accurate title, description, category, price, condition, location, and useful media.
Step 2: Add Good Photos
Clear photos help users understand what you are selling.
Whenever possible, show the product from several useful angles.
Step 3: Consider Product Video
If movement, condition, size, sound, or functionality matters, video can provide additional context.
Step 4: Publish a Short
When appropriate, create a short video that introduces the item or shows one important detail.
Step 5: Return to Analytics
Open Analytics from the left menu.
Step 6: Click Updates
Refresh the statistics so you can review the latest data shown on your page.
Step 7: Compare Results
Look at views, likes, comments, subscribers, categories, products, videos, and Shorts.
Step 8: Improve Future Content
Use what you learn when creating your next listing or video.
This process is simple enough for beginners while still giving you useful performance information.
Do Not Judge Content From One Metric
One of the most important analytics habits is to avoid focusing on only one number.
Views are useful, but they do not tell the complete story.
Likes can indicate interest, although some buyers may view a product without liking it.
Comments show interaction, yet many marketplace buyers may prefer to send a message rather than leave a public comment.
Subscribers can show longer term interest in your account.
For that reason, evaluate several metrics together.
For example, a listing with many views but little additional activity may need better photos, a clearer description, or a different price.
Meanwhile, a video with fewer views but several likes and comments may have attracted a smaller but more engaged audience.
Analytics help you notice these differences.
Compare Similar Types of Content
For more useful comparisons, compare similar content whenever possible.
A marketplace listing and a Short serve different purposes.
Likewise, a long video and a product listing should not necessarily be expected to generate the same behavior.
Instead, compare:
- Listing with listing
- Video with video
- Short with Short
- Category with category
This makes the results easier to understand.
For example, if you have five Shorts, identify which ones receive more views or engagement.
Then review what makes them different.
Perhaps the strongest Short reaches the main point faster. Maybe the product is more interesting, or the video clearly demonstrates something useful.
Those observations can guide your next upload.
Use Analytics to Improve Your Content Strategy
As your Npati account grows, Analytics can help you make better decisions about what to publish.
Suppose your Electronics listings regularly receive more views than another category.
You may decide to create more electronics listings if you have relevant products available.
Similarly, if product demonstration videos attract stronger interaction, you can create more videos that clearly show how an item works.
However, avoid changing your entire strategy because of one result.
Look for patterns across several pieces of content.
Over time, recurring patterns are usually more useful than a single spike in views or likes.
Analytics for Sellers
Sellers can use Analytics to answer practical questions.
For example:
Which listings are getting attention?
Compare product activity.
Are people viewing my content but not engaging with it?
Review views together with likes and comments.
Which categories perform better for my account?
Compare Views by categories and Likes by categories.
Could my product presentation be improved?
Review your photos, title, description, price, and product video.
Should I create more video content?
Compare the performance of your videos and Shorts with the rest of your activity.
These questions make Analytics more useful than simply checking numbers.
Analytics for Video Creators
Npati combines marketplace content with video features. Therefore, Analytics can also be useful for creators who focus more heavily on video.
A creator can review:
- Total views
- Likes
- Comments
- Subscribers
- Video activity
- Shorts activity
If one video performs especially well, look at the topic, presentation, length, opening, and usefulness of the content.
Then use those observations to plan future uploads.
At the same time, avoid copying the same video repeatedly. Instead, identify what viewers appeared to value and apply that lesson to new content.
What to Do When a Listing Gets Views but No Likes
This situation can happen, especially with marketplace content.
Views indicate that users are reaching the listing.
However, a lack of likes may mean several different things.
The product could still be new.
The price may need another look.
Photos might not show enough detail.
The description could be too short or unclear.
Alternatively, buyers may simply be viewing the item without using the Like feature.
Therefore, use Analytics as a starting point rather than as an automatic judgment.
Review the complete listing before deciding what to change.
What to Do When Content Gets Very Few Views
If a listing, video, or Short receives little viewing activity, first check the quality of the content itself.
For a listing, review:
- Title
- Category
- Description
- Photos
- Video
- Price
- Condition
- Location
A more complete listing gives potential buyers more information.
If the content is a Short or regular video, consider whether the topic is clear and whether the first part of the video gives viewers a reason to continue watching.
After making improvements, continue publishing and compare future results.
One piece of content is rarely enough to understand a complete performance trend.
Why Simple Analytics Can Be Useful
Analytics software does not need to be complicated to provide value.
For many sellers and creators, the most important questions are straightforward:
- Is anyone viewing my content?
- What is receiving the most attention?
- Are users engaging?
- Am I gaining subscribers?
- Which categories are working best?
- How are my listings, videos, and Shorts performing?
Npati Analytics places these core statistics in one page so you can check them quickly.
As a result, you can spend less time looking for individual statistics and more time improving what you publish.
Frequently Asked Questions About Npati Analytics
What is Npati Analytics?
Npati Analytics is a dashboard for reviewing statistics connected to your account, listings, videos, and Shorts. It can show metrics such as subscribers, total views, likes, comments, category activity, and content performance.
Where can I find Analytics on Npati?
Sign in to your account and select Analytics from the menu on the left side of Npati.
Why is my Npati Analytics page empty?
New accounts may not have enough content or activity to display meaningful statistics. Create listings, upload videos, or publish Shorts first, then return to Analytics.
How do I refresh Npati Analytics?
Open the Analytics page and click Updates to refresh the statistics currently displayed.
Can I see listing views on Npati?
The Analytics page provides information about viewing activity and includes a Products area for marketplace content.
Does Npati Analytics show video statistics?
Yes. Analytics includes a Videos section where you can review activity connected to your uploaded videos.
Can I check Shorts performance on Npati?
Yes. Analytics includes a Shorts section. If you have not uploaded any Shorts yet, the page may instead show an option to upload your first Short.
Does Npati Analytics show likes?
Yes. The overview includes Total likes, and the dashboard can also include Likes by categories.
Does Npati Analytics show comments?
The Analytics overview includes a Comments metric so you can quickly review this type of engagement.
Can I see my subscribers in Analytics?
Yes. Subscribers are included among the main statistics shown in the Analytics overview.
What are Views by categories?
Views by categories helps you understand how viewing activity is distributed among categories connected to your content.
What are Likes by categories?
Likes by categories gives you another way to compare engagement across different content categories.
Should I change a listing if it has few views?
Not immediately. First, check the title, category, description, price, condition, photos, video, and location. In addition, compare the listing with similar content and look for patterns across more than one result.
Is Npati Analytics only for sellers?
The page is especially useful for sellers, but video creators and users publishing Shorts can also use it to review content activity.
Related Npati Guides
Analytics become much more useful after you have created and published quality content.
If you are new to Npati, begin with How to Create a Npati Account and How to Set Up Your Npati Profile.
When you are ready to sell, follow How to Create a Listing on Npati.
Next, improve the quality of your marketplace content with How to Write a Better Npati Listing and How to Add Photos to a Npati Listing.
If video is useful for your product, continue with How to Add Product Video to a Npati Listing.
Finally, creators who want to publish short form content can read How to Upload a Short Video on Npati.
Start Using Npati Analytics
Npati Analytics gives sellers and creators a simple way to see what is happening with their content.
Open Analytics from the left menu, click Updates, and review your subscribers, views, likes, comments, category activity, Products, Videos, and Shorts.
If your account is new, start by creating content first.
Then return to Analytics as your listings and videos begin receiving activity.
Most importantly, do not treat Analytics as a collection of numbers that you check once and forget. Use the information to understand your audience, improve your listings, create better videos, and decide what you want to publish next.
The more useful content you create, the more meaningful your Npati Analytics dashboard can become.